The cost of ownership of a 1000 applications
Cost reduction is one of the main focuses of so many companies out there today. The market is not great, and that is the moment companies take a deep look at the financials of it all.
One of the first things that is being asked is: What are we really spending?
Not just the big hard numbers like contracts and licences, but everything. The hidden costs and invisible hours.
This is weirdly something not a lot of companies know. Today, we will take a look at just that: TCO (total cost of ownership), and how you can start mapping it across your entire application landscape.
The outline.
The idea is simple: take every business application in your landscape, break its costs into categories, and combine them into a single number. Or, if numbers aren’t available, a t-shirt size. Simple enough. Now do it for a thousand applications.
But things get messy when we actually start the exercise.
Total Cost of Ownership feels like a clear, manageable concept, until you try to measure it. What begins with server costs quickly spirals. What about storage? Backups? Do you include electricity, if you’re hosting in-house1? And that’s just the surface of it all.
There is also the cost of building, maintaining, training, … I’m sure you can think of dozens more parameters.
Remember, we’re doing this at scale. Every extra detail you include means another person to ask, another number to update, another layer to manage.
But here’s the trade-off: too little data, and your TCO becomes useless. You want something clear. Something that tells the story of the cost.
For example: Application X costs 500,000 per year. You break it down: 180K on infrastructure and another 100K on training. Suddenly, you’re not just seeing a total cost. You’re seeing an opportunity. Maybe that training cost tells you it’s time to invest in better UX.
That’s what this is really about: not just knowing the number, but knowing how to change it.
For me, the best way to go about this is to map this out in categories, and the ones I’ve settled on are:
- Development
- Licensing
- Infrastructure
- Support & Maintenance
- End-user Support
- Misc
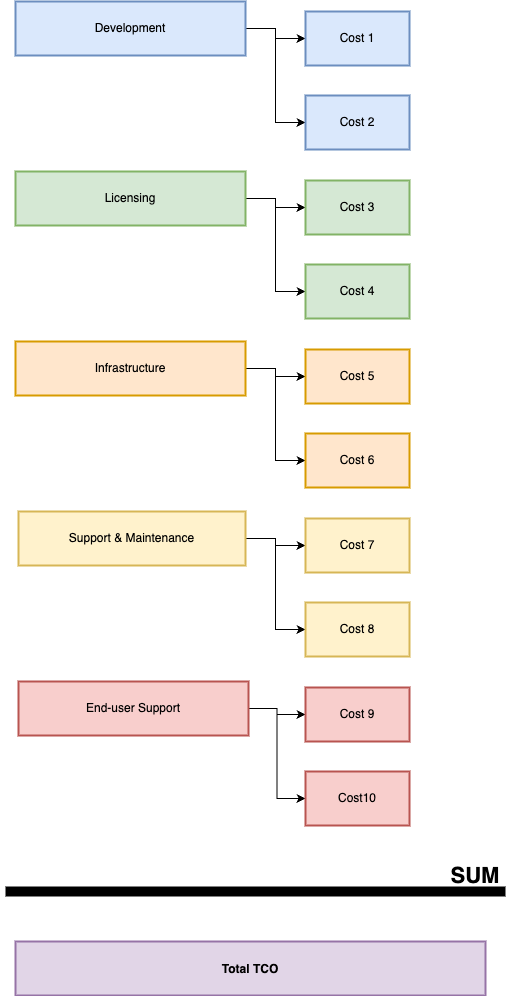
I won’t go through every detail of every category, this isn’t a textbook, and every organization has its own quirks. I will however give you a rough outline that you can use to shape it to your needs.
Development
This category covers in-house development.
If you’ve built the application yourself, take the total cost: FTE’s 2, tools, consulting, whatever it took to make the thing. And spread it across five years.
Why five? Because without that, you get a big spike in year one that skews everything. You want apples to apples.
If the application is off-the-shelf or SaaS, this category will likely sit at zero. And that’s okay. Not every column needs to be filled.
Licensing
This is your “buy” column: SaaS, commercial software, vendor tools…
Licensing can be deceptively complex. You’ve got per-seat pricing, per-admin models, resource usage tiers… I always normalize it. I use “cost per unit” as a base metric. It helps highlight inefficiencies fast.
For example, if someone only reads reports, maybe they don’t need that premium admin licence. Trim where it makes sense.
Infrastructure
This covers servers, storage, backups: the whole physical and virtual stack.
In some cases, infrastructure is bundled into licensing (think cloud platforms). If that’s true, you can merge them. If not, keep them separate. Just be consistent.
What matters most is visibility: where the app lives, and what it costs to keep it breathing.
Support & Maintenance
Now we’re into the hard stuff: the cost of keeping things running. Bug fixes. Patches. Support tickets.
Some companies calculate this by assigning a cost per bug. That works, but I prefer a more stable approach: support hours, tracked in FTEs. This will deviate less per month and doesn’t feel like punishment to the people working there.
Here’s how I break it down.
Two support engineers cover five applications? That’s 2 ÷ 5 = 0.4. Round it up to 0.5 FTE per app. (I always move in steps of 0.5, there is no need for more details I feel)
If that application constantly escalates bugs to the dev team, bump the number.
It’s not perfect, but it gives you something consistent to track.
End-user Support
This one’s slippery. It covers training and minor feature requests. The human side of keeping an application usable.
Track training in FTEs. Not just the students, but whoever’s doing the teaching. That includes onboarding, train-the-trainer sessions, and refresher courses.
As for feature requests: draw a line:
- Big, roadmap-changing features go in Development.
- Small asks, tweaks, quality-of-life fixes go here.
And if you rely on a vendor for this kind of support? Log it here, not under licensing. That way, you can spot where the support load actually lives.
Misc
The vaguest one, but an important one. This is where I track three things: criticality, sensitivity, and legacy. I express each one as a percentage.
Is it business-critical? Does it handle sensitive data? Is it built on something ancient and fragile? The higher the percentage, the more weight it carries.
Yes, I know, that’s very unscientific and vague, but I do think it’s essential. We’re going to use these in the next step.
The thing about numbers…
Numbers are sensitive and not always easy to get hold of. And when you’re dealing with this many systems, they don’t always show up when you need them.
Not only that, but as you probably noticed in the previous chapter, we mix percentages, FTEs, exact figures. It might seem messy, but that’s the only way to capture something so layered.
You have to realize that the end number you’re going to end up with is not accurate. It is impossible to get a real accurate number out of this. There’s too much guesswork, too many estimates, too many people giving you ballparks instead of precision. That’s reality.
Don’t chase perfection. You won’t find it.
So give people options. If they know the cost, great. Write it down. If they don’t, let them give you a T-shirt size: S, M, L, XL, XXL. It’s fast, and surprisingly helpful at scale.
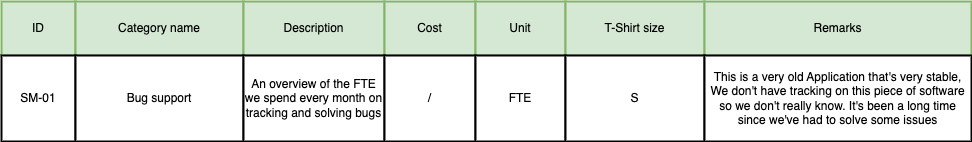
This helps if you run into situations where people just can’t answer you with real data. How many days a month do you spend on average on bug squashing? If you don’t have a clear setup to track these things, it would be impossible to know.
Remember: you’re doing this for 1,000 applications. Progress beats precision. Every estimate you get is better than one more week waiting on the “real” number.
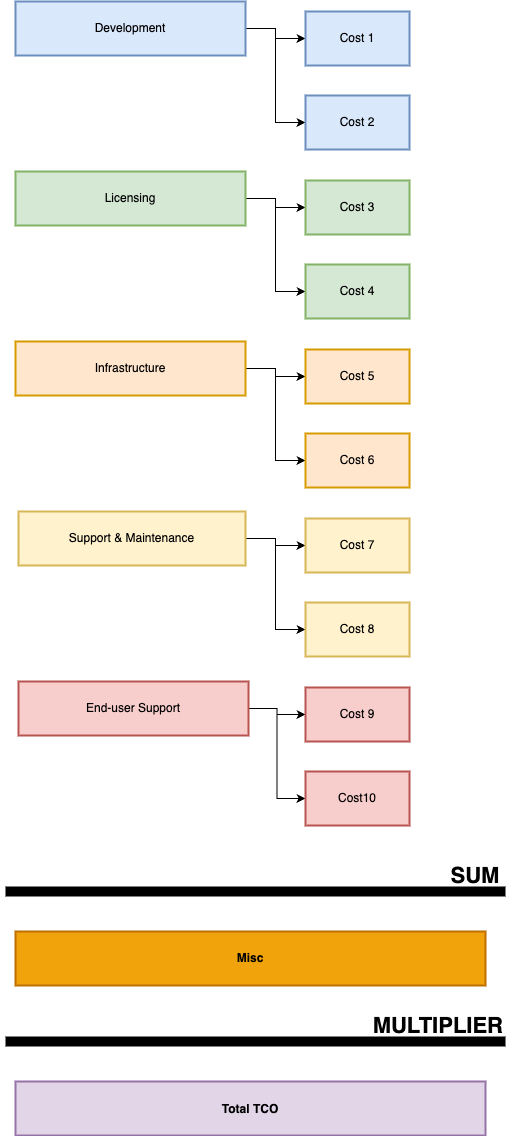
Getting to the final number
Now comes the tricky part: turning estimates into meaning.
Start by defining your defaults. What does a “Medium” look like for bug reports per month? Feature requests? These won’t be perfect. That’s okay. Set some gut-based baselines and refine them as you go. An “M” for some companies can be a “S” for others they can and even will change over time. Don’t be afraid to revisit them later on.
The same with the FTE calculations, that’s the cost per day of a person working in that position. Again, an average.
Once those are locked in, total up your categories. You’ll have a rough annual cost per application.
Now, what about that Misc tab with the percentages? Those percentages: criticality, sensitivity and legacy should affect the rest. Not by simple addition. You’ll need to apply a weighting system to the total cost. A legacy app doesn’t just cost money it also costs effort.
It’s up to you how you want to weigh these multipliers. I would not just add the percentage to the number, as that would quickly get out of hand. Instead, you might want to use a lighter touch. It’s best to experiment here.
Scaling it up
Once your model’s ready, it’s time to gather data. Keep the entry points soft and friendly. A well-designed form, a guided tool, a low-code application with just the right help text. These things matter.
Don’t overload anyone. Break your model into pieces, and send each one to the person best suited to answer it. Let Finance handle licensing. Let Ops tackle infrastructure. Let people speak in their own language. The last thing you want is to scare people with information they know nothing about.
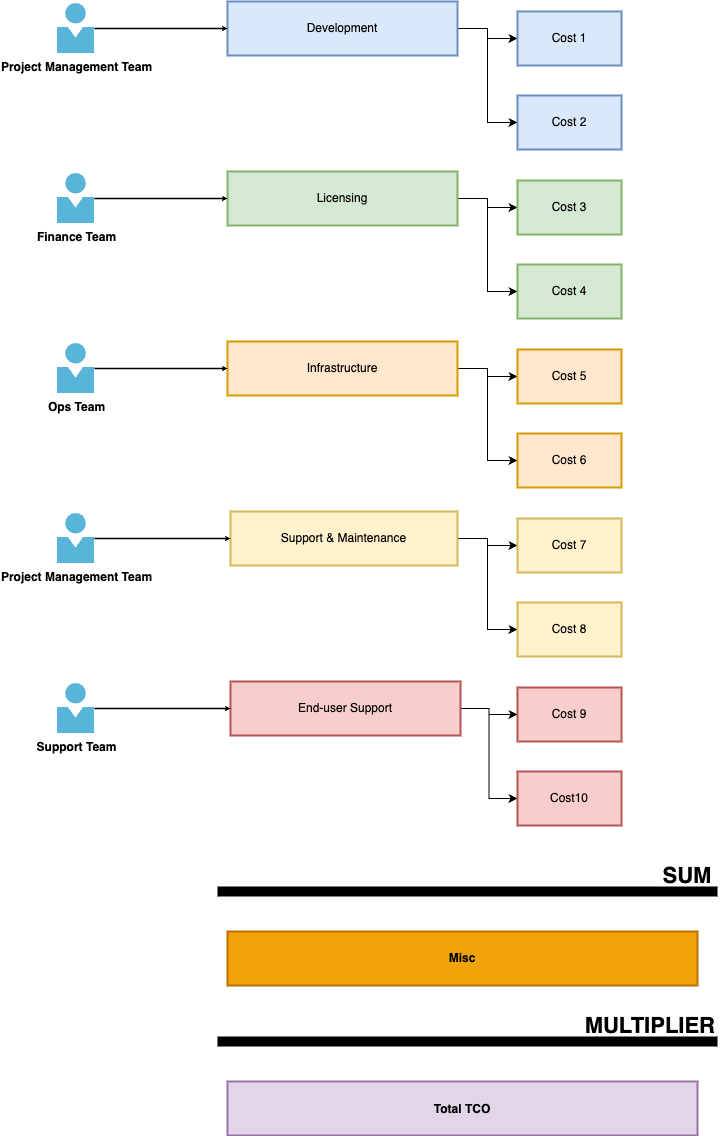
And whatever you do, keep the calculations hidden. Not to be secretive, but to protect the integrity of the answers. If people can see how the sausage is made, they’ll start shaping the meat.
Once you have everything set up, it’s selecting the right people and sending out the forms.
Don’t expect instant returns. You’re building momentum, not flipping a switch.
Try to do it in small sections and run a POC first, where you only scope out a 20. That way, you can see if you have some faults in your system. Before you open it up to maybe batches of 50 to 100’s.
The end goal is for people to come to you with the information so you don’t have to chase them every few years. That will only happen if your insights at the end of the project give enough value and reach the right people.
So, make sure that you also present this information with some actionable insights. That should be very doable with a setup like this.
TCO is messy, imperfect, and often imprecise, but so is everything worth understanding. Start somewhere. Adjust as you go. Just don’t wait for perfect.
further readings... in [Enterprise Architecture]


Systems Thinking in Enterprise Architecture
I first learned of systems thinking in the domain of city planning, and that is apparently also where the idea comes from. It was described …
Read EntryWhat is a Value Stream and how does it relate to a Value Chain
Organizations often use “value stream” and “value chain” as interchangeable labels. It’s not the biggest architectural drama in the …
Read Entry